Receiver Operating Characteristic (ROC) Curve
The ROC curve is a visualization of the trade-off between high sensitivity and high specificity1.
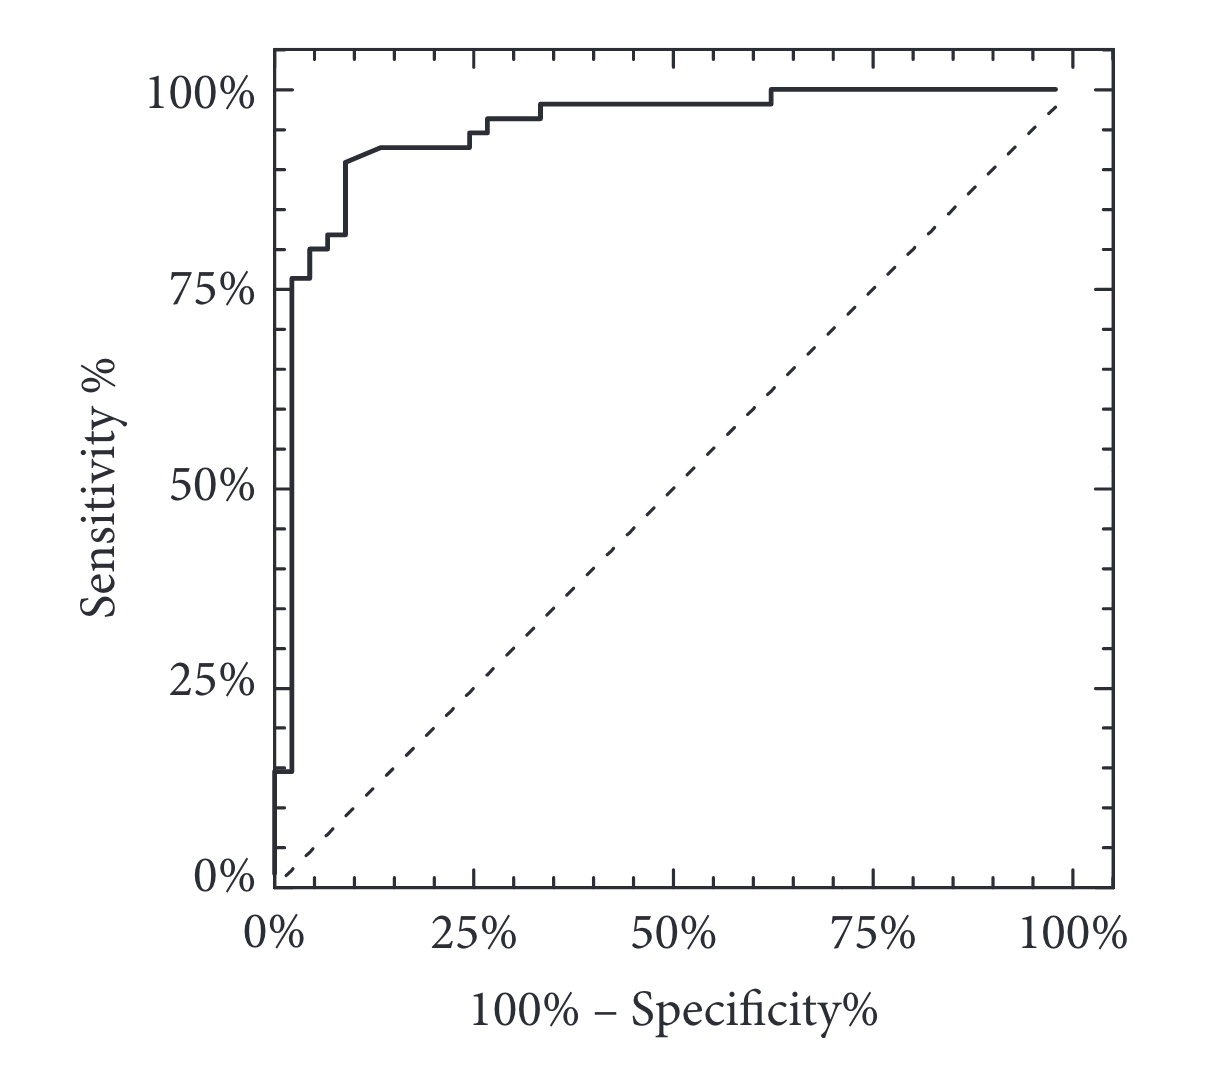
Reading an ROC Curve
What is the best cut-off?
Choosing the ideal cut-off point is dependent on the consequences of a false negative or false positive.
- If both consequences are equally bad: The best threshold is the one that corresponds to the point on the ROC curve that is closest to the upper-left corner of the graph.
- Generally, the consequences are not comparable.
- It will be difficult to decide what cut-off makes the most sense. That decision must be made by someone who understands the disease and the test. It is not a decision to be made by a computer program.
Bayesian Logic
See Bayesian logic p4481
Area under the Curve (AUC)
See Receiver operating characteristic curve: overview and practical use for clinicians2
- ideal ROC curve thus has an AUC = 1.0.2
- Therefore, for any diagnostic technique to be meaningful, the AUC must be greater than 0.5
- in general, it must be greater than 0.8 to be considered acceptable
Confidence Interval
For any test to be statistically significant, the lower 95% CI value of the AUC must be > 0.5
| AUC | Interpretation |
|---|---|
| \(0.9 \geq \textrm{AUC}\) | Excellent |
| \(0.8 \geq \textrm{AUC} \geq 0.9\) | Good |
| \(0.7 \geq \textrm{AUC} \geq 0.8\) | Fair |
| \(0.6 \geq \textrm{AUC} \geq 0.7\) | Poor |
| \(0.5 \geq \textrm{AUC} \geq 0.6\) | Fail |
| \(0.0 \geq \textrm{AUC} \leq 0.5\) | Worse than flipping a coin |
Sample size
Common Mistakes
Automating the decision about which point on an ROC curve to use as a cut-off
The ROC curve plots the trade-offs between sensitivity and specificity. Which combination is the best to define a critical value of a lab test? It depends on the consequences of making a false positive or a false negative diagnosis. That decision needs to be made in a clinical (or in some situations, scientific) context and should not be automated.
Thinking that a single value can quantify the accuracy of a test
There are many ways to quantify accuracy