Product-Moment Correlation Coefficient (r)
- Pearson Product-Moment Correlation Coefficient (r)
Purpose
Determine linear relationship between two continuous random variables1
Measure: Strength of the linear relationship (Covariance)1
- Results in Correlation Coefficient
Results
The correlation coefficient (r) is the main result of a correlation. It is computed as the ratio of covariance between the variables to the product of their standard deviations.
Interpretation
-1 to +11
| Strength | Value |
|---|---|
| Negligible | 0.00–0.101 |
| Weak | 0.10–0.391 |
| Moderate | 0.40–0.691 |
| Strong | 0.70–0.891 |
| Very strong | 0.90–1.001 |
| Perfect Correlation | -1 or +11 |
Interpretation
Perfect correlation
- -1 or +1
- All the data points lie exactly on the straight line
You should always graph your results to ensure you arent missing correlations that are not linear
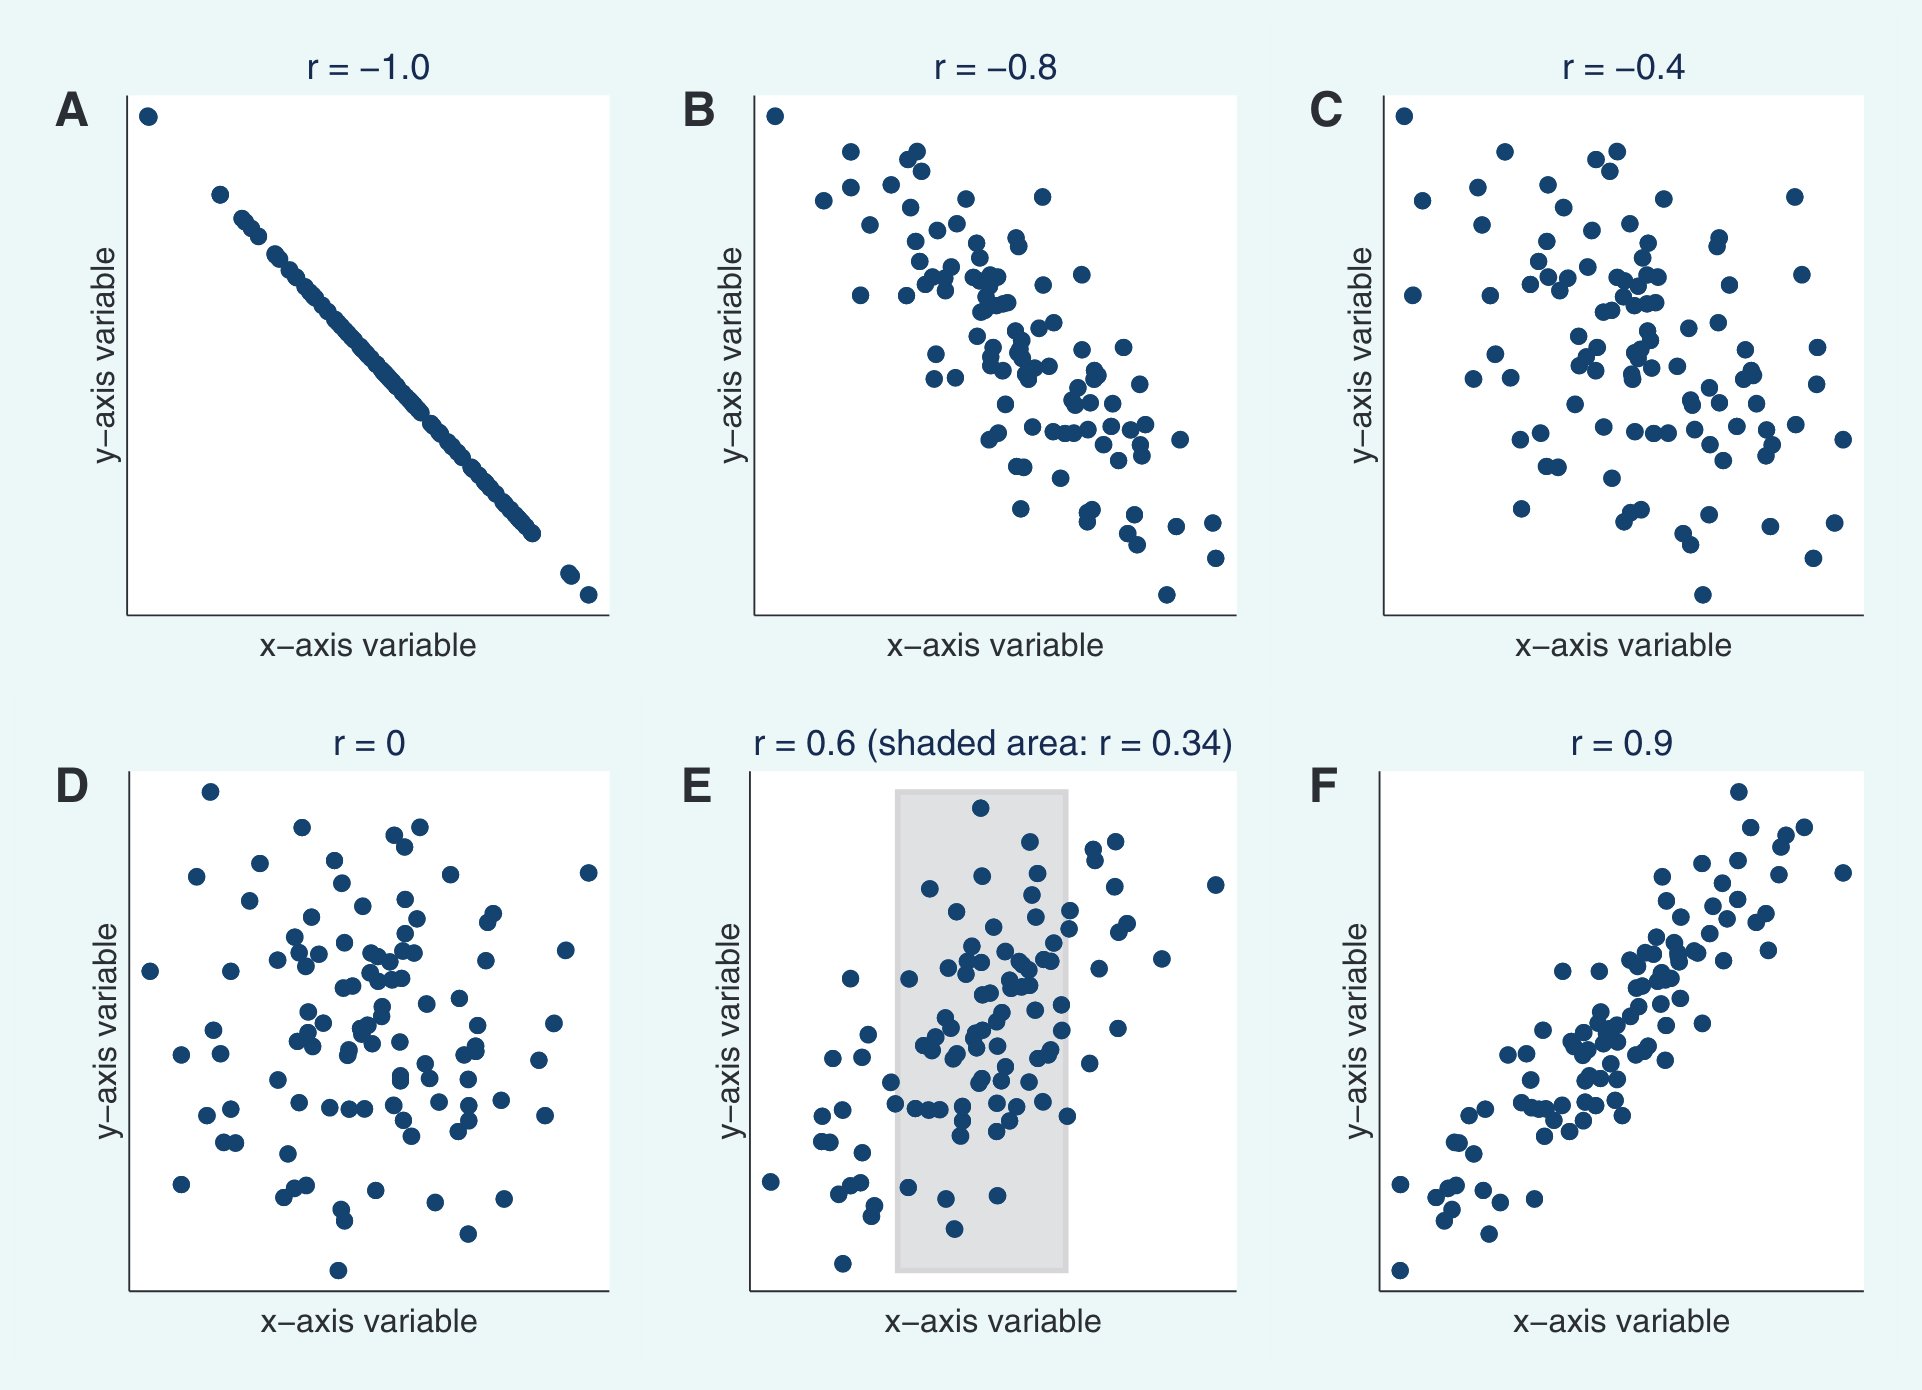
NOTE: these can be used by researchers to misrepresent data that is not linearly correlated1
Significance
- T-Test?
- P-value = correlation differs significantly from Zero
Compared to other analyses
see the comparison to other correlation statistical analyses
“Many studies give the product–moment correlation coefficient (r) between the results of two measurement methods as an indicator of agreement. However, correlation studies the relationship between one variable and another, not the differences, and it is not recommended as a method for assessing the comparability between methods”2